
On this page
- Why the old valuation rules break on growth stocks
- The valuation methods I use, compared at a glance
- The P/E ratio: a starting point, not an answer
- The PEG ratio: connecting price to the growth you’re paying for
- Price-to-sales: the metric for companies that don’t earn yet
- EV/Sales: the cleaner cousin of price-to-sales
- Discounted cash flow: useful for what it forces you to admit
- The Rule of 40: a quality check, not a price tag
- How to value growth stocks in practice: putting it all together
- Frequently asked questions
- The Bottom Line
- The complete growth stock valuation series
The first time I tried to value a fast-growing company, I did what every textbook told me to do: I looked at the P/E ratio, saw a number north of 70, and walked away. The stock tripled over the next three years. That mistake taught me more than any course ever did, and it’s the reason I’m writing this. Learning how to value growth stocks means accepting that a high multiple isn’t automatically expensive — you’re paying for future earnings, not today’s, so the real job is judging whether the growth you’re buying is worth the price tag. Use forward multiples, the PEG ratio, price-to-sales, and a sanity-check DCF together; no single number tells the truth.
That’s the short version. The longer version is what I’ve learned over years of getting some of these calls right and plenty of them wrong, and it’s worth your time because valuing growth is genuinely harder than valuing a stable, dividend-paying business. Below I’ll walk through every method I actually use, where each one shines, and — just as important — where each one will quietly lead you off a cliff.

Why the old valuation rules break on growth stocks
Most of us learn valuation through the value-investing lens: find a company trading below what it’s worth based on current earnings or book value, buy the gap, wait. It’s a beautiful framework. It also falls apart the moment you point it at a company growing revenue 30% or 40% a year and plowing every spare dollar back into the business.
Here’s the tension. A company compounding sales at 35% and reinvesting aggressively in R&D will always carry a richer multiple than a utility growing at 3%. That’s not the market being irrational — it’s the market pricing in earnings that don’t exist yet. The hard part is deciding how much of that premium is justified. Overpay and you can sit on dead money for years even if the company executes flawlessly. Demand value-investor multiples and you’ll talk yourself out of the best performers of the decade, exactly like I did with that first stock.
So the goal isn’t to find “cheap.” It’s to find a price where the growth, if it shows up roughly as expected, still leaves you a good return. If you’re newer to the whole style and want the foundations first, our complete guide to Growth Stock Investing lays out the groundwork these methods sit on top of. And if you haven’t fully decided which camp you’re in, the Growth vs Value Investing comparison is worth reading before you go further — the valuation math is different precisely because the underlying logic is.
The valuation methods I use, compared at a glance
Before I break each one down, here’s the cheat sheet I wish someone had handed me early on. None of these is “the right one.” They’re tools, and each is good at a specific job and dangerous when used for the wrong one. I reach for several on every name and look for them to agree.
| Method | What it measures | Good for | Where it misleads |
|---|---|---|---|
| P/E (forward) | Price per dollar of expected earnings | Profitable companies; quick comparisons | Useless for unprofitable firms; ignores growth rate |
| PEG | P/E divided by earnings growth rate | Comparing growth-adjusted “expensiveness” | Garbage in, garbage out on the growth estimate |
| P/S (price-to-sales) | Price per dollar of revenue | Pre-profit, high-growth companies | Ignores margins entirely; a low-margin firm looks cheap |
| EV/Sales | Enterprise value per dollar of revenue | Apples-to-apples across different debt loads | Same margin blind spot as P/S |
| DCF | Present value of future cash flows | Forcing your assumptions out into the open | Wildly sensitive to inputs; false precision |
| Rule of 40 | Growth rate + profit margin | Sanity-checking software/SaaS quality | Not a price metric; says nothing about valuation |
Notice the pattern in that last column. Almost every method has a blind spot, and the blind spots don’t overlap — which is exactly why I never trust one number alone. P/E ignores growth, PEG depends on a forecast, price-to-sales ignores margins. Use them together and they cover each other’s weaknesses.
The P/E ratio: a starting point, not an answer
The price-to-earnings ratio is where almost everyone begins, and that’s fine — as long as you treat it as the opening line of the conversation rather than the verdict. It divides the share price by earnings per share, so it tells you how many dollars investors are paying for each dollar the company earns. A stock at $100 with $5 of EPS trades at 20x: twenty dollars of price for one dollar of annual earnings.
Growth stocks run hot here. The broad market has historically hovered somewhere around the mid-to-high teens to low 20s on earnings — and even that range drifts over time, so check current figures rather than trusting a number you memorized. Fast growers, by contrast, routinely trade at 40x, 60x, sometimes triple-digit earnings. That’s the market saying it expects tomorrow’s earnings to dwarf today’s. Whether it’s right is the whole game.
Forward P/E versus trailing P/E
This distinction matters more for growth than for anything else. Trailing P/E uses the last twelve months of actual reported earnings. Forward P/E uses analysts’ estimates for the next twelve months. For a company whose earnings are climbing fast, the trailing number is almost a historical artifact — it’s describing a smaller, earlier version of the business.
A hypothetical makes it concrete. Say a company trades at 80x trailing earnings, which sounds nosebleed-expensive. But suppose its earnings are expected to roughly double over the coming year. Its forward P/E would land around 40x — still pricey, but a completely different conversation. I lean on forward multiples for growth names, while keeping in mind that “forward” means “someone’s guess,” and guesses about high-growth companies are wide. When estimates are all over the map, the forward number is softer than it looks.
When P/E quietly lies to you
P/E breaks in a few situations that happen to be common among exactly the companies you’d want to own. A business reinvesting everything into growth may report razor-thin or negative earnings while the underlying economics are excellent — and you can’t divide by a negative in any meaningful way. Heavy stock-based compensation can flatter or distort the bottom line depending on how you count it. One-time charges, write-downs, or accounting choices can swing the ratio around for reasons that have nothing to do with the business.
My take: P/E is a thermometer, not a diagnosis. It’s a fast read on how much optimism is already baked in, and it’s great for comparing two profitable companies in the same industry. The instant a company isn’t reliably profitable, you need a different tool — which brings us to the ratios built for that.
The PEG ratio: connecting price to the growth you’re paying for
If I had to pick the single most useful number for thinking about how to value growth stocks, it’s the PEG ratio. It fixes the biggest flaw in plain P/E — that P/E says nothing about how fast the company is growing — by dividing the P/E by the expected annual earnings growth rate. Peter Lynch popularized it, and the logic is elegant: a stock at 30x earnings growing 30% a year has a PEG of 1.0, and so does a stock at 60x growing 60%. On a growth-adjusted basis, they’re priced the same.
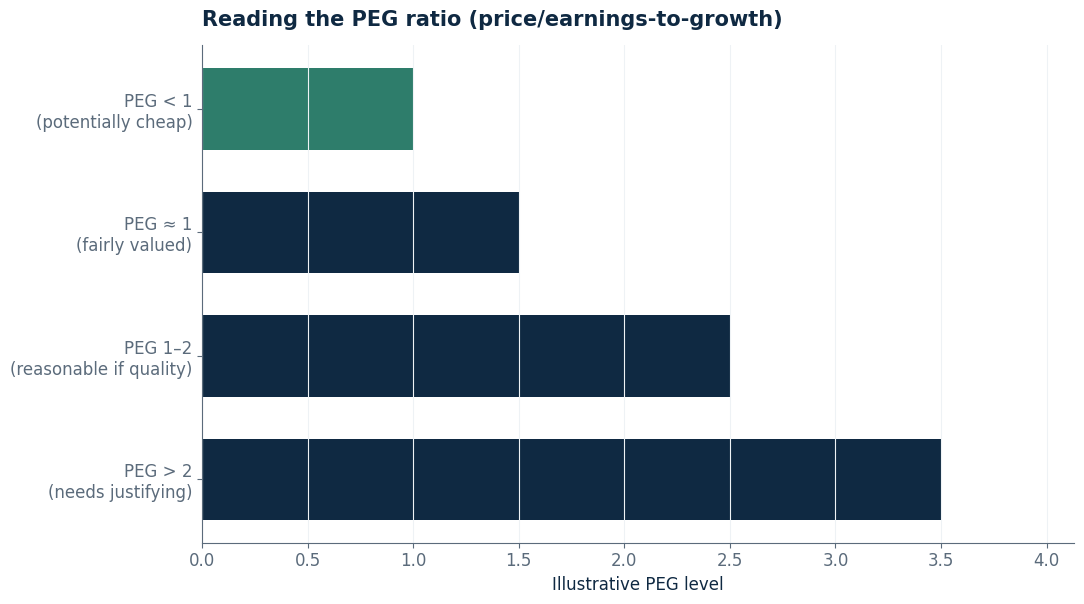
How to read a PEG ratio
Lynch’s original rule of thumb was clean. A PEG below 1.0 hints the stock may be cheap relative to its growth; above 1.0, you’re starting to pay up. In the real world, I — and most growth investors I respect — will happily pay PEG ratios in the 1.0 to 1.5 range for companies with a genuine, durable competitive advantage. Quality deserves a premium. Once you climb past 2.0, the market is charging you well beyond what growth alone justifies, usually for a powerful brand, a wide moat, or pure momentum. That’s not automatically a “no,” but it is a “know exactly what you’re paying for and why.”
I want to be honest about the limits, though. PEG flatters very high growth rates — a company “growing 80%” gets a tiny, attractive-looking PEG, but 80% growth is fragile and rarely lasts. It also says nothing about quality of earnings or balance-sheet risk. So I treat PEG as a ranking tool to compare similar companies, not as a precise valuation that spits out a target price.
Calculating PEG without fooling yourself
The formula is trivial; the inputs are everything. For the P/E component, use forward earnings, not trailing — you want price measured against the earnings the growth rate is actually describing. For the growth rate, use the consensus expected annual EPS growth over the next three to five years, not a single year. This is the mistake I see most often: someone grabs one freakish growth year, plugs it in, and gets a PEG that’s pure fiction. Growth is lumpy. A multi-year rate smooths out the noise and gives you something you can lean on.
And remember the cardinal rule — garbage in, garbage out. The whole ratio rests on a growth forecast, and forecasts for hot companies are routinely too rosy near the top and too gloomy near the bottom. If you wouldn’t bet on the growth number yourself, don’t trust the PEG it produces. Getting comfortable judging those growth estimates is its own skill; our guide to How to Find Growth Stocks Before They Explode goes deeper on spotting durable growth before it’s obvious, which is exactly the input PEG depends on.
Price-to-sales: the metric for companies that don’t earn yet
A huge share of the most exciting growth companies aren’t profitable — on purpose. They’re spending hard to capture a market while it’s up for grabs. P/E can’t help you there, because there are no positive earnings to divide by. Price-to-sales (P/S) steps in. It divides market value by revenue, telling you how many dollars you’re paying for each dollar of sales.
This is the right lens for early-stage, fast-scaling businesses, and I use it constantly for them. A company growing revenue 50% a year with no profit yet might trade at, say, 12x or 15x sales in a hypothetical example — a number that’s meaningless in isolation but useful once you compare it to peers growing at similar rates.
The trap with P/S is enormous and worth tattooing on your forearm: it completely ignores margins. A software company that will eventually keep 80 cents of every revenue dollar and a hardware reseller that keeps four cents can sport the identical P/S, and one of them is wildly more valuable than the other. Revenue you can’t ever turn into profit is not worth much. So whenever I use price-to-sales, I immediately ask: what does this business look like at maturity? What’s the realistic long-run profit margin? A 10x sales multiple on a future-80%-margin business is a very different bet than 10x on a future-10%-margin business, even though the ratio reads the same.
EV/Sales: the cleaner cousin of price-to-sales
EV/Sales does the same job as price-to-sales but swaps market cap for enterprise value — that’s market cap plus debt, minus cash. Why bother? Because two companies can have identical market caps and wildly different financial situations: one drowning in debt, the other sitting on a mountain of cash. Enterprise value captures what it would actually cost to buy the whole business, debt and all, so it lets you compare companies on a level field regardless of how they’re financed.
For most cash-rich, debt-light growth companies, EV/Sales and P/S land close to each other, and either works. But the moment debt enters the picture — and some growth companies do carry meaningful debt — EV/Sales is the more honest number. My habit: glance at both. If they diverge a lot, that gap is telling you something about the balance sheet, and a stretched balance sheet is a real risk that the equity-only metrics hide. EV/Sales inherits the same margin blind spot as P/S, though, so the “what does this look like at maturity?” question still applies in full.
Discounted cash flow: useful for what it forces you to admit
I have a complicated relationship with discounted cash flow models. A DCF projects a company’s future free cash flows and discounts them back to today’s dollars, giving you an estimate of intrinsic value you can compare to the current price. In theory it’s the most rigorous valuation method there is. In practice, for high-growth companies, it can be a machine for manufacturing false confidence.
The problem is sensitivity. A DCF on a fast grower depends on a long-term growth rate, a terminal value, and a discount rate — and tiny changes to any of them swing the output dramatically. Nudge your growth assumption up two points and extend the runway a couple of years, and you can “justify” almost any price you started with. I’ve watched smart people reverse-engineer a DCF to defend a stock they’d already decided to buy. The model didn’t tell them anything; it just dressed up a hunch in spreadsheet clothing.
So here’s how I actually use DCF, and why I still bother. Its real value isn’t the precise number that pops out the bottom — it’s that building one forces every assumption into the open. To finish the model you have to commit, on paper, to how fast you think the company grows, for how long, at what margin, and how risky those cash flows are. That discipline is gold. I run a DCF less to get an answer and more to see what I’d have to believe for today’s price to make sense — and then I ask whether I actually believe it. If the price only works assuming 25% growth for a decade straight, that’s a useful, slightly scary thing to know before you buy.
My honest advice: don’t anchor on a single DCF output to the dollar. Run a few scenarios — conservative, base, optimistic — and look at the range. If the stock looks reasonable even under cautious assumptions, that’s a far stronger signal than a single rosy model hitting your target exactly.
The Rule of 40: a quality check, not a price tag
The Rule of 40 isn’t a valuation metric at all, and I want to be clear about that so you don’t misuse it — but it’s such a handy sanity check for software and subscription businesses that it earns a spot here. The idea: a healthy SaaS company’s revenue growth rate plus its profit margin should add up to at least 40. A company growing 50% while burning at a -10% margin clears it (50 minus 10 equals 40). So does one growing 20% at a 20% margin. Both are balancing growth and profitability acceptably.
It’s a fast way to tell whether a company is buying its growth at a reasonable cost or torching cash to fake momentum. A business growing 60% but running a -40% margin scrapes by at 20 — it’s “growing,” sure, but the economics are shaky. What the Rule of 40 will never do is tell you whether the stock is cheap or expensive. A company can ace it and still be priced for perfection. Use it to judge business quality, then use the price metrics above to judge the price. Two separate questions.
How to value growth stocks in practice: putting it all together
People want a single magic formula, and I get it — but the honest answer is that I triangulate. For a profitable grower, I start with forward P/E and PEG to see how much optimism is priced in relative to the growth rate. For a pre-profit company, I lead with price-to-sales or EV/Sales, always paired with a hard think about future margins. I’ll build a rough DCF to surface what the current price is implicitly assuming. And for software names I run the Rule of 40 as a quality gate before I bother with any of it.
Then I look for agreement. If forward P/E says rich, PEG says reasonable, and my conservative DCF still works, I lean in. If three methods scream expensive and only one optimistic model can rescue the price, I pass — or I size the position small and accept I might be wrong. Valuation isn’t a verdict you compute; it’s a weight of evidence you assemble. And it’s only ever half the job. The other half is risk: how big the position should be, what you do if the thesis breaks, and how much volatility you can stomach. I’d genuinely rather own a slightly-overpriced great company in the right position size than a “cheap” one I’ve oversized, which is why our guide to Risk Management for Growth Stock Investors is the natural companion to everything here.
If you want to see how these methods land on the kinds of companies people are weighing right now, our roundup of the Best Growth Stocks to Buy in 2026 shows the same thinking applied to current names — though, as always, the figures move, so treat any specific number there as a snapshot to re-check, not gospel.
Frequently asked questions
What is a good P/E ratio for a growth stock?
There’s no universal “good” number — that’s the honest answer. Growth stocks routinely trade at 40x, 60x, or higher because the market expects earnings to climb fast. A 50x P/E can be perfectly reasonable for a company growing 40% a year and far too rich for one growing 15%. Always read the multiple against the growth rate, which is exactly what the PEG ratio does.
Is a high PEG ratio always bad?
Not necessarily. A PEG above 2.0 means you’re paying well beyond what raw growth justifies, often for a durable moat, a dominant brand, or strong momentum. Sometimes that premium is earned. The PEG ratio also leans entirely on a growth forecast, so an unreliable estimate produces an unreliable PEG. I use it to rank similar companies, not as a hard buy-or-sell trigger.
How do you value a growth stock with no profits?
Lean on revenue-based metrics, mainly price-to-sales or the debt-aware EV/Sales, since there are no earnings to anchor a P/E. The catch is that both ignore margins entirely. A pre-profit company is only worth a high sales multiple if it can plausibly turn that revenue into real profit one day, so pair the ratio with a realistic estimate of long-run margins before you trust it.
Should I use a DCF model for growth stocks?
You can, but handle it carefully. A DCF is hypersensitive to assumptions, and small tweaks to the growth rate or discount rate swing the output wildly — it’s easy to “prove” whatever you already believe. I find its real value is forcing my assumptions into the open and showing what the current price implies. Run conservative, base, and optimistic scenarios and look at the range, not one number.
What’s the difference between forward and trailing valuation?
Trailing metrics use the last twelve months of actual reported results; forward metrics use analyst estimates for the next twelve months. For fast growers, forward figures usually matter more because they reflect where the business is heading rather than where it’s been. Just remember “forward” means “an estimate,” and estimates for high-growth companies carry wide error bars, so treat them as a guide, not a fact.
The Bottom Line
Learning how to value growth stocks comes down to one shift in thinking: a high multiple isn’t a red flag by itself — it’s a question. What growth are you being asked to pay for, and is it worth it? Use forward P/E and PEG for profitable companies, price-to-sales or EV/Sales for the pre-profit ones, a scenario-based DCF to expose your assumptions, and the Rule of 40 to judge quality. No single metric is trustworthy alone; the confidence comes from making several of them agree. Get that habit right, pair it with disciplined risk management, and you’ll avoid the mistake I made early on — walking away from a great company simply because its price tag looked big at first glance.
The complete growth stock valuation series
Each valuation tool below gets its own deep dive. Together they make up the full toolkit I use to put a defensible number on a growth company.
- How to Compare Growth Stock Valuations
- Discounted Cash Flow Analysis for Growth Stocks
- EV-to-Revenue Ratio
- Forward PE vs Trailing PE
- Free Cash Flow Analysis for Growth Stocks
- GARP Investing Strategy
- How to Calculate Intrinsic Value of Growth Stocks
- Margin of Safety in Growth Stock Investing
- PEG Ratio Explained
- Price-to-Sales Ratio
- The Rule of 40 for SaaS Stocks
- Terminal Value in DCF Analysis
- Unit Economics for Growth Stock Investors
- How to Tell When a Growth Stock Is Overvalued
Last updated: June 2026. Figures are approximate and change — confirm current data before investing. Educational only, not individual investment advice.